| Contents | 1 | 2 | 3 | 4 | 5 | 6 | 7 | 8 | 9 | 10 | 11 | 12 | 13 | 14 | 15 | 16 | 17 | 18 | 19 | 20 | 21 | 22 | Previous | Next |
| 11. Query Filtering |
|
CROME’s “Group Editor” provides an easy means to filter any report based on physical network items. For filtering on the performance data itself, the threshold, sorting and limiting features of the CROME Report Items are powerful methods to quickly limit and filter the data. But threshold, sorting, and limiting features work on data that has already been fetched from the database. There may be occasions where an advanced user wishes to limit the actual data fetched into the CROME Report. If a particular CROME Report requires an excessive amount of data to be fetched, only to be filtered after the fact, it may prove much faster to limit the amount of data being fetched, especially if network/WAN transfer speeds are a factor. To accomplish this type of filtering, CROME provides, as an advanced feature, the ability to insert any arbitrary “where clause” filter into the SQL query. This Query Filters can be typed on the fly, edited and saved locally or on the server by the system administrator, or be permanently associated with system or local reports. We consider this an “advanced” feature because the user has the ability to create queries that are illegal or do not result in any useful data. First, we will discuss how to select a pre-defined Query Filter on the Main CROME Screen, and create your own Query Filter. Then we will discuss how to permanently associate a Query Filter with a CROME Report. |
| Query Filtering on the CROME Main Screen | Top |
|
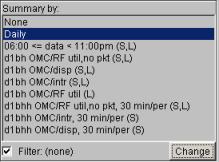
On the bottom-right corner of the CROME Main Screen, there is a checkbox for “Filter” and a button that says “Change”:
By default, Filter is checked OFF, meaning that CROME queries will run normally. When checked ON, and the Filter name listed is not “(none)”, every CROME Report will run with the selected Query Filter until it is checked OFF or changed to “(none)”. To enable a Query Filter, click the Change Button. This will launch the Query Filter Files window:
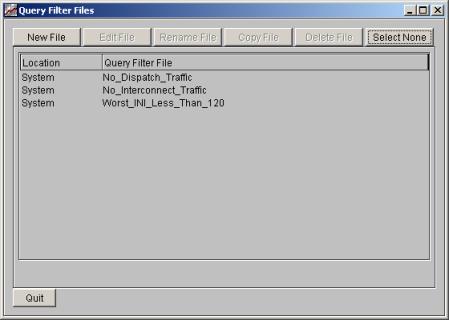
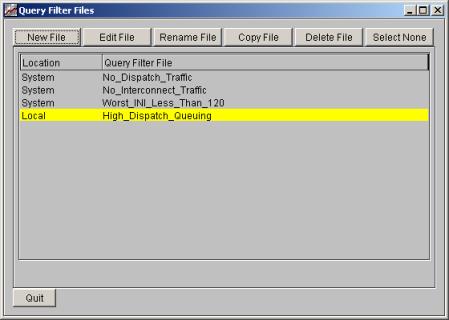
In the above example, there are three “System” Query Filters available for this system type (i.e., in this example an iDen OMC). Each line in this window represents a file, either on the server (if a “System” Query Filter) or on the user’s PC (if a “Local” Query Filter). To see the contents of the file, we can double-click on, for example, Worst_INI_Less_Than_120. This will bring up the Query Filter Set window:
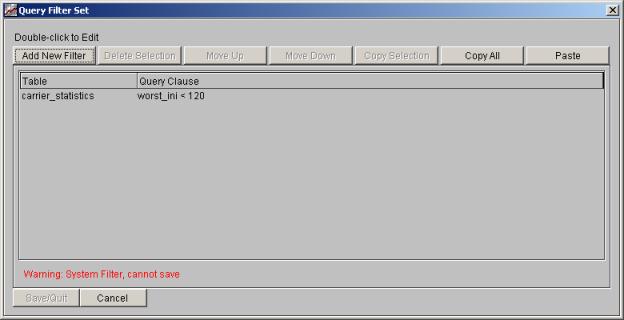
A Query Filter Set is, simply, a set of Query Filters. A Query Filter is a “where clause” in a query. As you can see in this example, this Query Filter Set contains only one Query Filter, namely a where clause that says, for the table carrier_statistics, query where worst_ini < 0. Meaning, for any report that uses this Query Filter Set and only if the report uses data from the table carrier_statistics, then this where clause will be included in the query. A Query Filter Set can contain any number of Query Filters, which will be joined together by an “and” clause. Closing this window and looking back at the Query Filter Files window, if we select the third item “carrier_statistics”, it will highlight in yellow and the main screen will change to show the selected Query Filter:
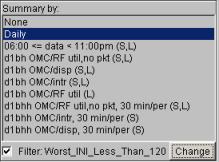
Now that the Query Filter is selected, any report that is Run that use this filter, but only if the tables in the query match the tables in the query filter, else the Query Filter is ignored. To see an example of the use of this Query Filter, run the system report called Carrier_Low_INI. This report has a built-in threshold to filter the carrier_statistics table for worst_ini values that are less than 120. But like all CROME report thresholds, it does this filtering AFTER the query has been performed and after the data has been brought across the WAN into the CROME client. If we run the Carrier_Low_INI report with this Query Filter selected, the data will be filtered during the query, and thus potentially much less data will come across the WAN. This will make this report run much faster, possibly 10 times faster, depending on your data and network transfer speeds. Note that when using the CROME Report Threshold feature, all data is queried and then the data is limited based on the threshold. And since you have all the data, you can easily turn OFF the threshold in a live Report Item and then see ALL the data, even data that did not meet the threshold requirement. But when using a Query Filter, although usually a much faster query, you only query the data that meets the threshold, and thus if you wish to see ALL the data you would need to run the report again without using the Query Filter. |
| Making and Saving Custom Query Filters | Top |
|
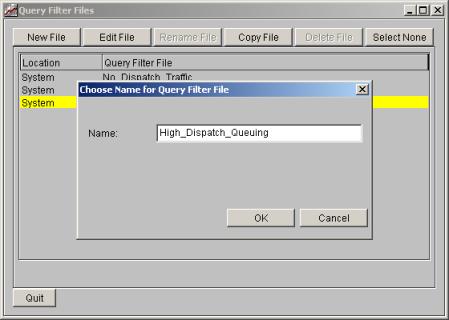
In the above example, we examined Query Filters that were saved on the CROME Server. It is very easy to make your own local Query Filters. By clicking the “Change” button on the bottom-right corner of the CROME Main Screen, we see the Query Filter File window, depicting all saved Query Filter Sets. To create a new one, simply click on the New File button, and type the desired name of the new Query Filter. In this example, we’ll make one called High_Dispatch_Queuing:
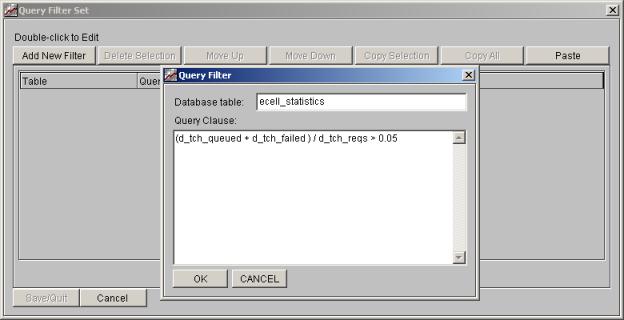
Clicking OK will trigger a new Query Filter Set window. In this window, Click Add New Filter, which will bring up the Query Filter window. In this window, type the desired database table and the desired “where clause” to perform high dispatch queuing:
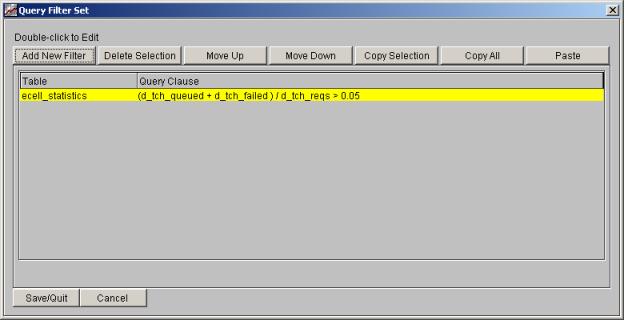
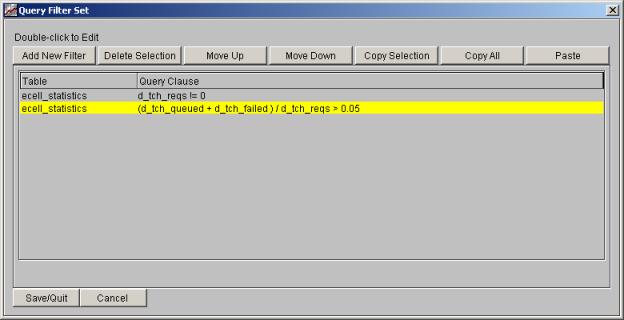
Clicking “OK” in the Query Filter window, and you will see this clause listed in the Query Filter Set:
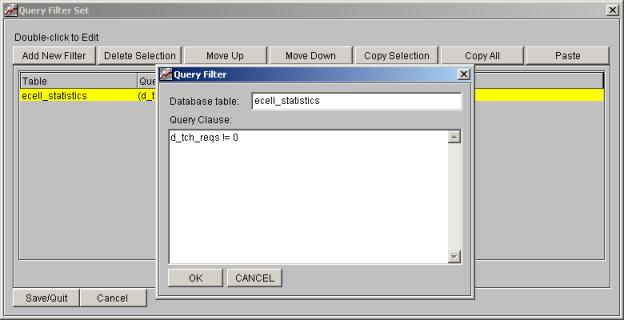
But in this example, we’ve created a query that has a peg as a denominator. Since dividing by zero will cause an error in the query, we need to add an additional clause to prevent this. Click Add New Filter and type another clause to prevent the denominator from being zero:
You can also use the Move Up and Move Down buttons to change the order of the Query Filters in this Query Filter Set to a desired order. For example, after clicking OK above, we can click on the second Query Filter (d_tch_reqs != 0) and click Move Up, changing the order and making in the first clause in this Query Filter Set:
Now we can “Save/Quit” this file, causing it to become available for report filtering:
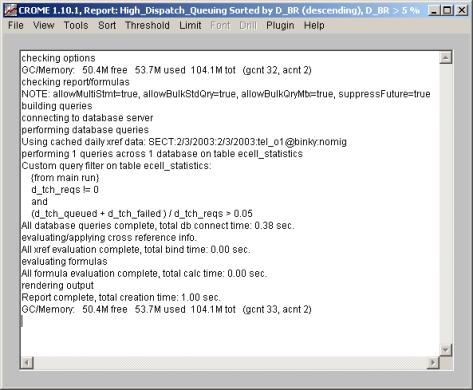
If we thus run any report that uses the table ecell_statistics, we can use the above Query Filter and limit the data according to the query clause. Note that whenever you run a report using a Query Filter, you can always choose “View / Status” from the Report Item, and see from the exact text of the Query Filter applied:
|
| Attached a Query Filter to a CROME Report | Top |
|
In the above examples, we showed how to choose System Query Filters from the CROME Main Screen and run a report using that filter, and how to create and save Local Query Filters and also run reports from the Main Screen using those filters. We can also attach a Query Filter to saved CROME Report, so that every time we run this report the Query Filter will be applied automatically. When Editing a CROME Report, there is a choice on the left side of the screen, below the other choices, for Query Filter:
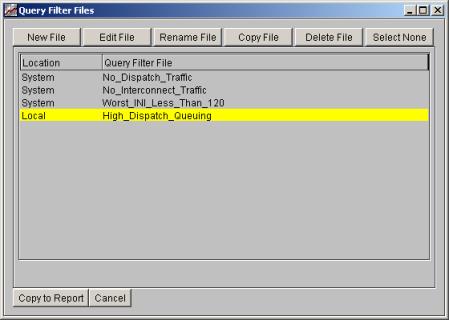
Choosing “Pick” is similar to picking a Query Filter from the CROME Main Screen, as described above. You can select System or Local Query Filters from a list, or edit/add new Local Query Filters. NOTE that when you Pick a Query Filter from the Report Editor, the contents of the Query Filter file will be copied into the Report (unlike formulas, which are referenced by Reports). This is why, when Picking a Query Filter to add to a report, you will see a Copy to Report button at the bottom:
Once you have copied an existing Query Filter to your report, the Report Editor will show that a Query Filter is present:
You can now edit this copy of the Query Filter or Remove it from the Report, or pick another one to copy. You do not need to pick an existing Query Filter at all, for that matter – you can simply start by clicking Edit and creating a Query Filter from scratch. When you save this Report, the Query Filter information will be saved along with it, so that every time you run the report the Query Filter will be applied. Note that you can still specify Query Filters from the Main Screen on any report, including reports that already have a Query Filter attached to it. In these cases, BOTH Query Filters (the Main Screen selection and the one in the Report definition) will be applied with an “and” clause joining them. |
| Contents | 1 | 2 | 3 | 4 | 5 | 6 | 7 | 8 | 9 | 10 | 11 | 12 | 13 | 14 | 15 | 16 | 17 | 18 | 19 | 20 | 21 | 22 | Previous | Next |
| Copyright © 1997-2005 Quantum Systems Integrators | Last modified: 30 Jun 2005 00:19 Authored by qmanual |